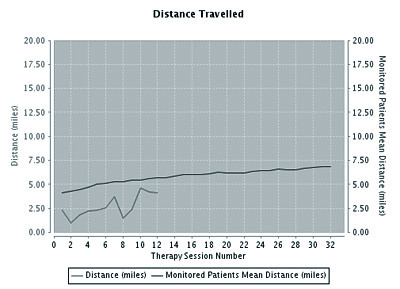
With my RTI electrical stimulation bike, I can check my progress online and see how I'm doing as all the information for each session is uploaded to a server. This graph compares my distance traveled (the bottom line) with the average of all riders (top line) based on the number of sessions. I'm below average for a start, but catching up pretty quickly. The bike knows when my legs get worn out and stops on its own; the first couple of sessions I only went for a few minutes, but I'm already up to a half-hour. I have fewer spasms now and some other benefits too, so I'm glad I've got the bike for sure.


Andrew your motivation is inspirational!
ReplyDeleteJ Andrew
And with that, your inspiring me to Pimp out the RTI bike!!! Lets do this! Matte finish, some ghost flames and some Ti hardware... Oh this is gona be good!!
ReplyDelete$$
...most excellent, Andrew!
ReplyDeleteAnd as one of the other posters said, inspirational indeed!
;-)
-Pawlie.
That RTI bike is smarter than some of us if it knows when you get tired!
ReplyDeletePrayers still going out from here, sir.